A Simple But Optimal Bitcoin Strategy
Bitcoin Rationality Index©
Now
Excitement/Anxiety
71
Yesterday
Excitement/Anxiety
71
30 days ago
Thrill/Complacency
84
1 year ago
Relief/Fear
43
Bitcoin investment strategy comparison, updated daily
| Strategy | Profit/Loss | ROI (time-weighted) |
|---|---|---|
| Rationality Index | $1,186,034 | 3362.02% |
| Mayer Multiple | $578,436 | 1407.99% |
| Buy and Hold | $342,566 | 230.23% |
| MA Crossover | $307,478 | 727.36% |
These are the returns from investing an initial $10,000 in bitcoin at the height of the last cycle peak on December 17, 2017, and using the above strategies to invest an additional $1,000 a month.
Don't want to be a day trader?
The Rationality Index is your long-term strategy.
UpsideSignal's Rationality Index allows us to choose optimal entry and exit points by measuring the risk and opportunity embodied in any given Bitcoin price level. We use this simple system to occasionally buy the lows and sell the highs for superior results.
At this risk level, the market sentiment varies between Excitement and Anxiety.
BTC historically spends only 92.34% of its timeline below the current level.
We do this because we don't want to suffer through 80% market declines and long bear markets. Nor do we want to be day traders. Our RI is unique in connecting Bitcoin prices with the investors' emotional roller coaster.
What's this roller coaster?
It was Warren Buffett who famously said, "Be fearful when others are greedy, and greedy when others are fearful."
If it were only that easy! When fear and greed take hold, we are easily gripped by our natural tendencies to buy and sell at the worst times. We are emotional beings, and are naturally inclined to make such portfolio killing errors in the heat of the moment.
Here's what happens to most of us when we start investing with little experience:
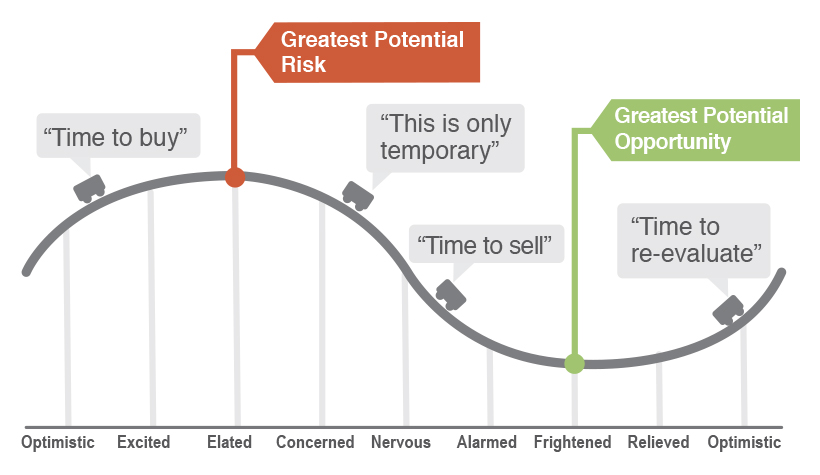
Don't let this happen to you!
We need a system to cool our emotions - to remind us when the market is euphoric, that it's actually at its point of highest risk. And, when the market is depressed, that is has reached the point of maximum financial opportunity.
Using the Rationality Index© Signals to Buy and Sell
We have done exhaustive back testing of the RI against other indicator signals to find an optimal buy sell strategy for timing our own Bitcoin investments. Below is a summary of how those methods performed in our testing. These numbers are updated daily, so you can see how they are performing to date:
Results since the last cycle peak (2017, Dec 17th):
| Strategy | Profit/Loss | Raw returns | ROI (time-weighted) | CAGR |
|---|---|---|---|---|
| Rationality Index | $1,186,034 | 1,379.11% | 3362.02% | 74.61% |
| Mayer Multiple | $578,436 | 672.60% | 1407.99% | 53.22% |
| Buy and Hold | $342,566 | 398.33% | 230.23% | 20.67% |
| MA Crossover | $307,478 | 357.53% | 727.36% | 39.42% |
The optimal RI strategy resulted from purchasing at 20 (buy 100% of available cash at or below index level 20) and selling at 98 (sell entire position at or above index level 98). After the first sell, re-buy with 100% of available cash at or below index level 15.
Note that this result came from just 2 buy and 1 sell orders.
Nothing More Un-Common Than Common Sense
The most successful strategy of all, historically speaking, has involved just a handful of trades, buying in peak depression and selling in peak euphoria.
Of course it's common sense to buy low and sell high, but as Frank Lloyd Wright said, "There is nothing more un-common than common sense." We think our Rationality Index, can help us keep common sense close when it really matters.
Another way to think about what the Rationality Index is telling us -- it reminds us to exercise extreme caution when trading in no man's land. That's all the area in between the Euphoria and Depression levels. Only you can decide where your comfort level lies, balancing your tolerance for risk, position sizing and investing time horizon. These are difficult choices. Our aim is to make these key decisions easier using 'common sense' tools built on a foundation of advanced math.
Share and Embed
Feel free to share or embed our bitcoin Rationality Index image widget.
